Edge Cases and Padding Schemes Study
Table of contents
We designed an experiment to specifically study the edge cases and padding related issues in Generating Predictions. To recap, our model always takes in a fixed window of data to make predictions. Should the remaining data not be enough to make up a whole fixed window, we need to pad them somehow; otherwise, they will be discarded. We offer two options for padding: zero padding and wrap-around padding. However, their impact on the overall prediction accuracy is unknown, which is the question we try to answer in this study.
The Experiment
We randomly sampled 21k 14-min windows from the test split of the AusDIAB dataset; we sampled at most 100 segments from any individual subject (patient) to counter data source skewness. The first 7-min are for wrap-around padding to consume and serve as a reference. We then mask parts of the last 7-min of the segments to create 1-min, 2-min, …, and 7-min windows and feed these windows to the model for predictions. To compute some of the metrics, we defined “sitting” as positive in our predictions and “not-sitting” as negative.
Results
Accuracy and Balanced Accuracy
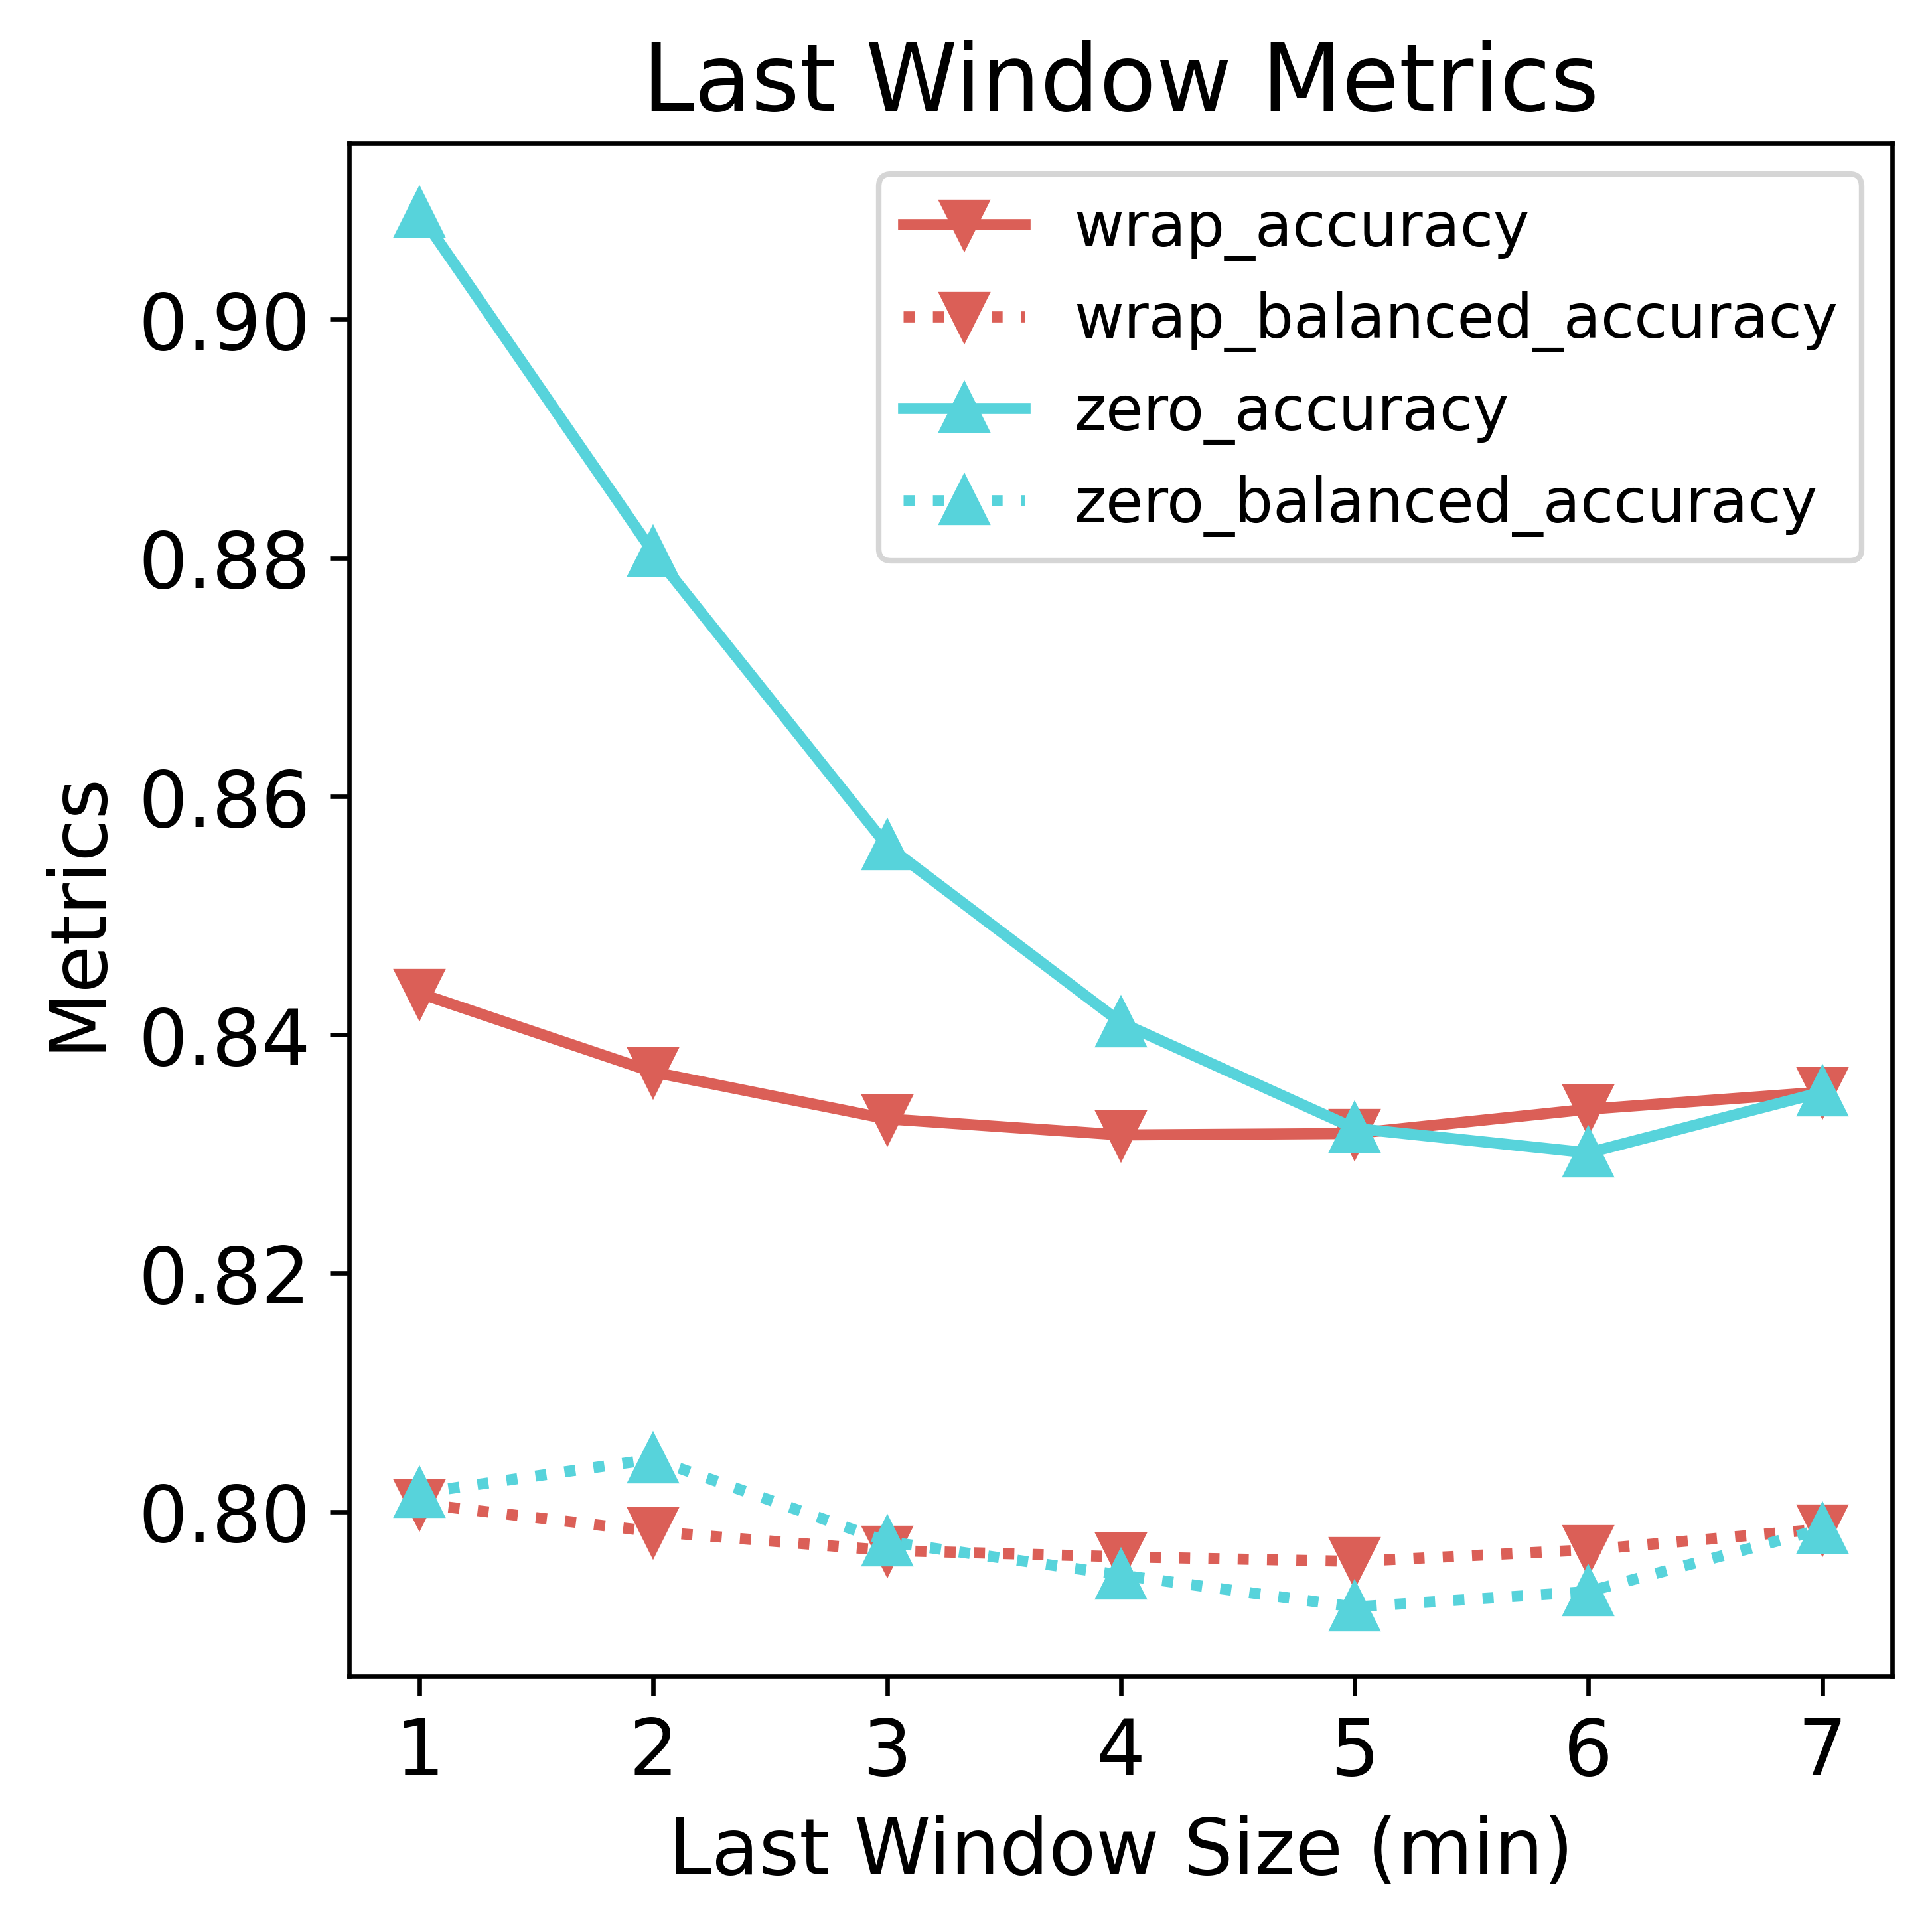
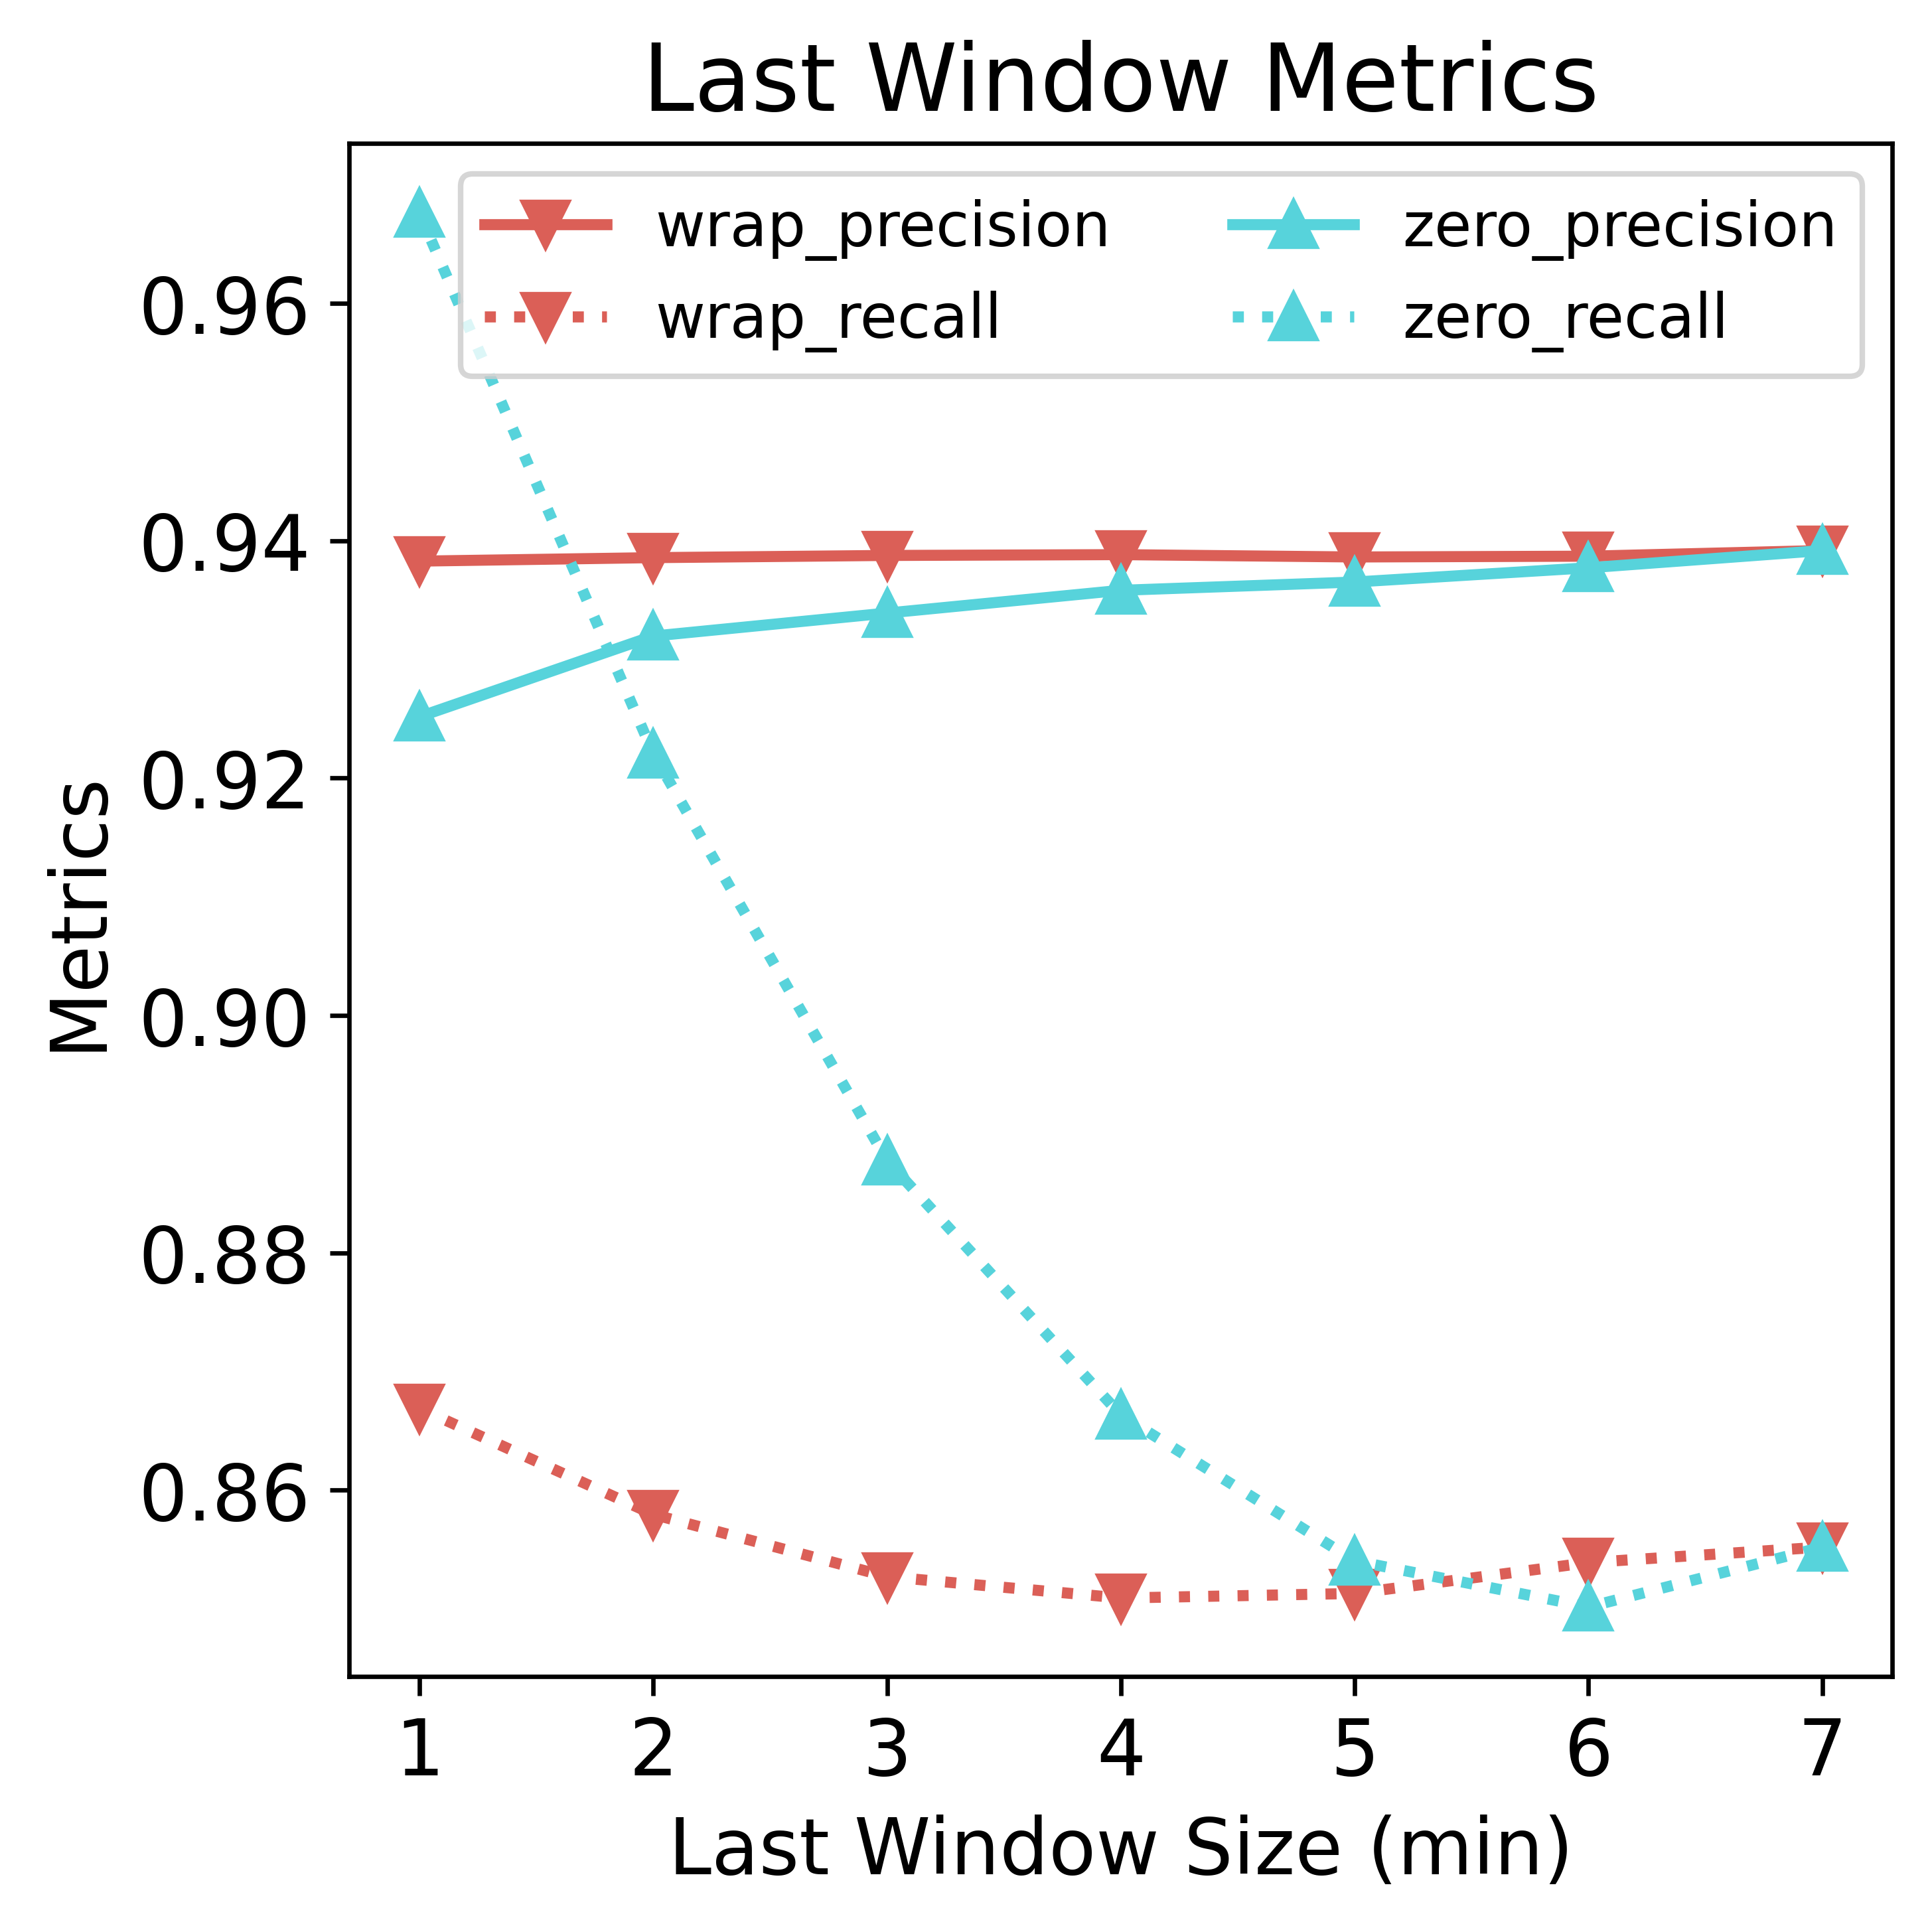
The model would treat zeros as true data and not as special tokens. As a consequence, padding zeros would trick the model into predicting lots of “sitting” because zeros in the data resemble more sitting than not-sitting. Zero-padding hurts the precision (primarily because of more false positives) but benefits the recall (primarily because of more true positives and fewer false negatives). However, since the data is imbalanced, the net effect is increased accuracy compared to wrap-around padding. The gap is much narrower if we look at the balanced accuracy, however. As for the wrap-around method, all metrics remain relatively stable, albeit a slightly curved shape dipped at around 3~4 min, suggesting degraded performance when about half of the data is borrowed from the preceding window. In some scenarios, it could outperform zero padding by a slight margin.
Confusion Matrix Components
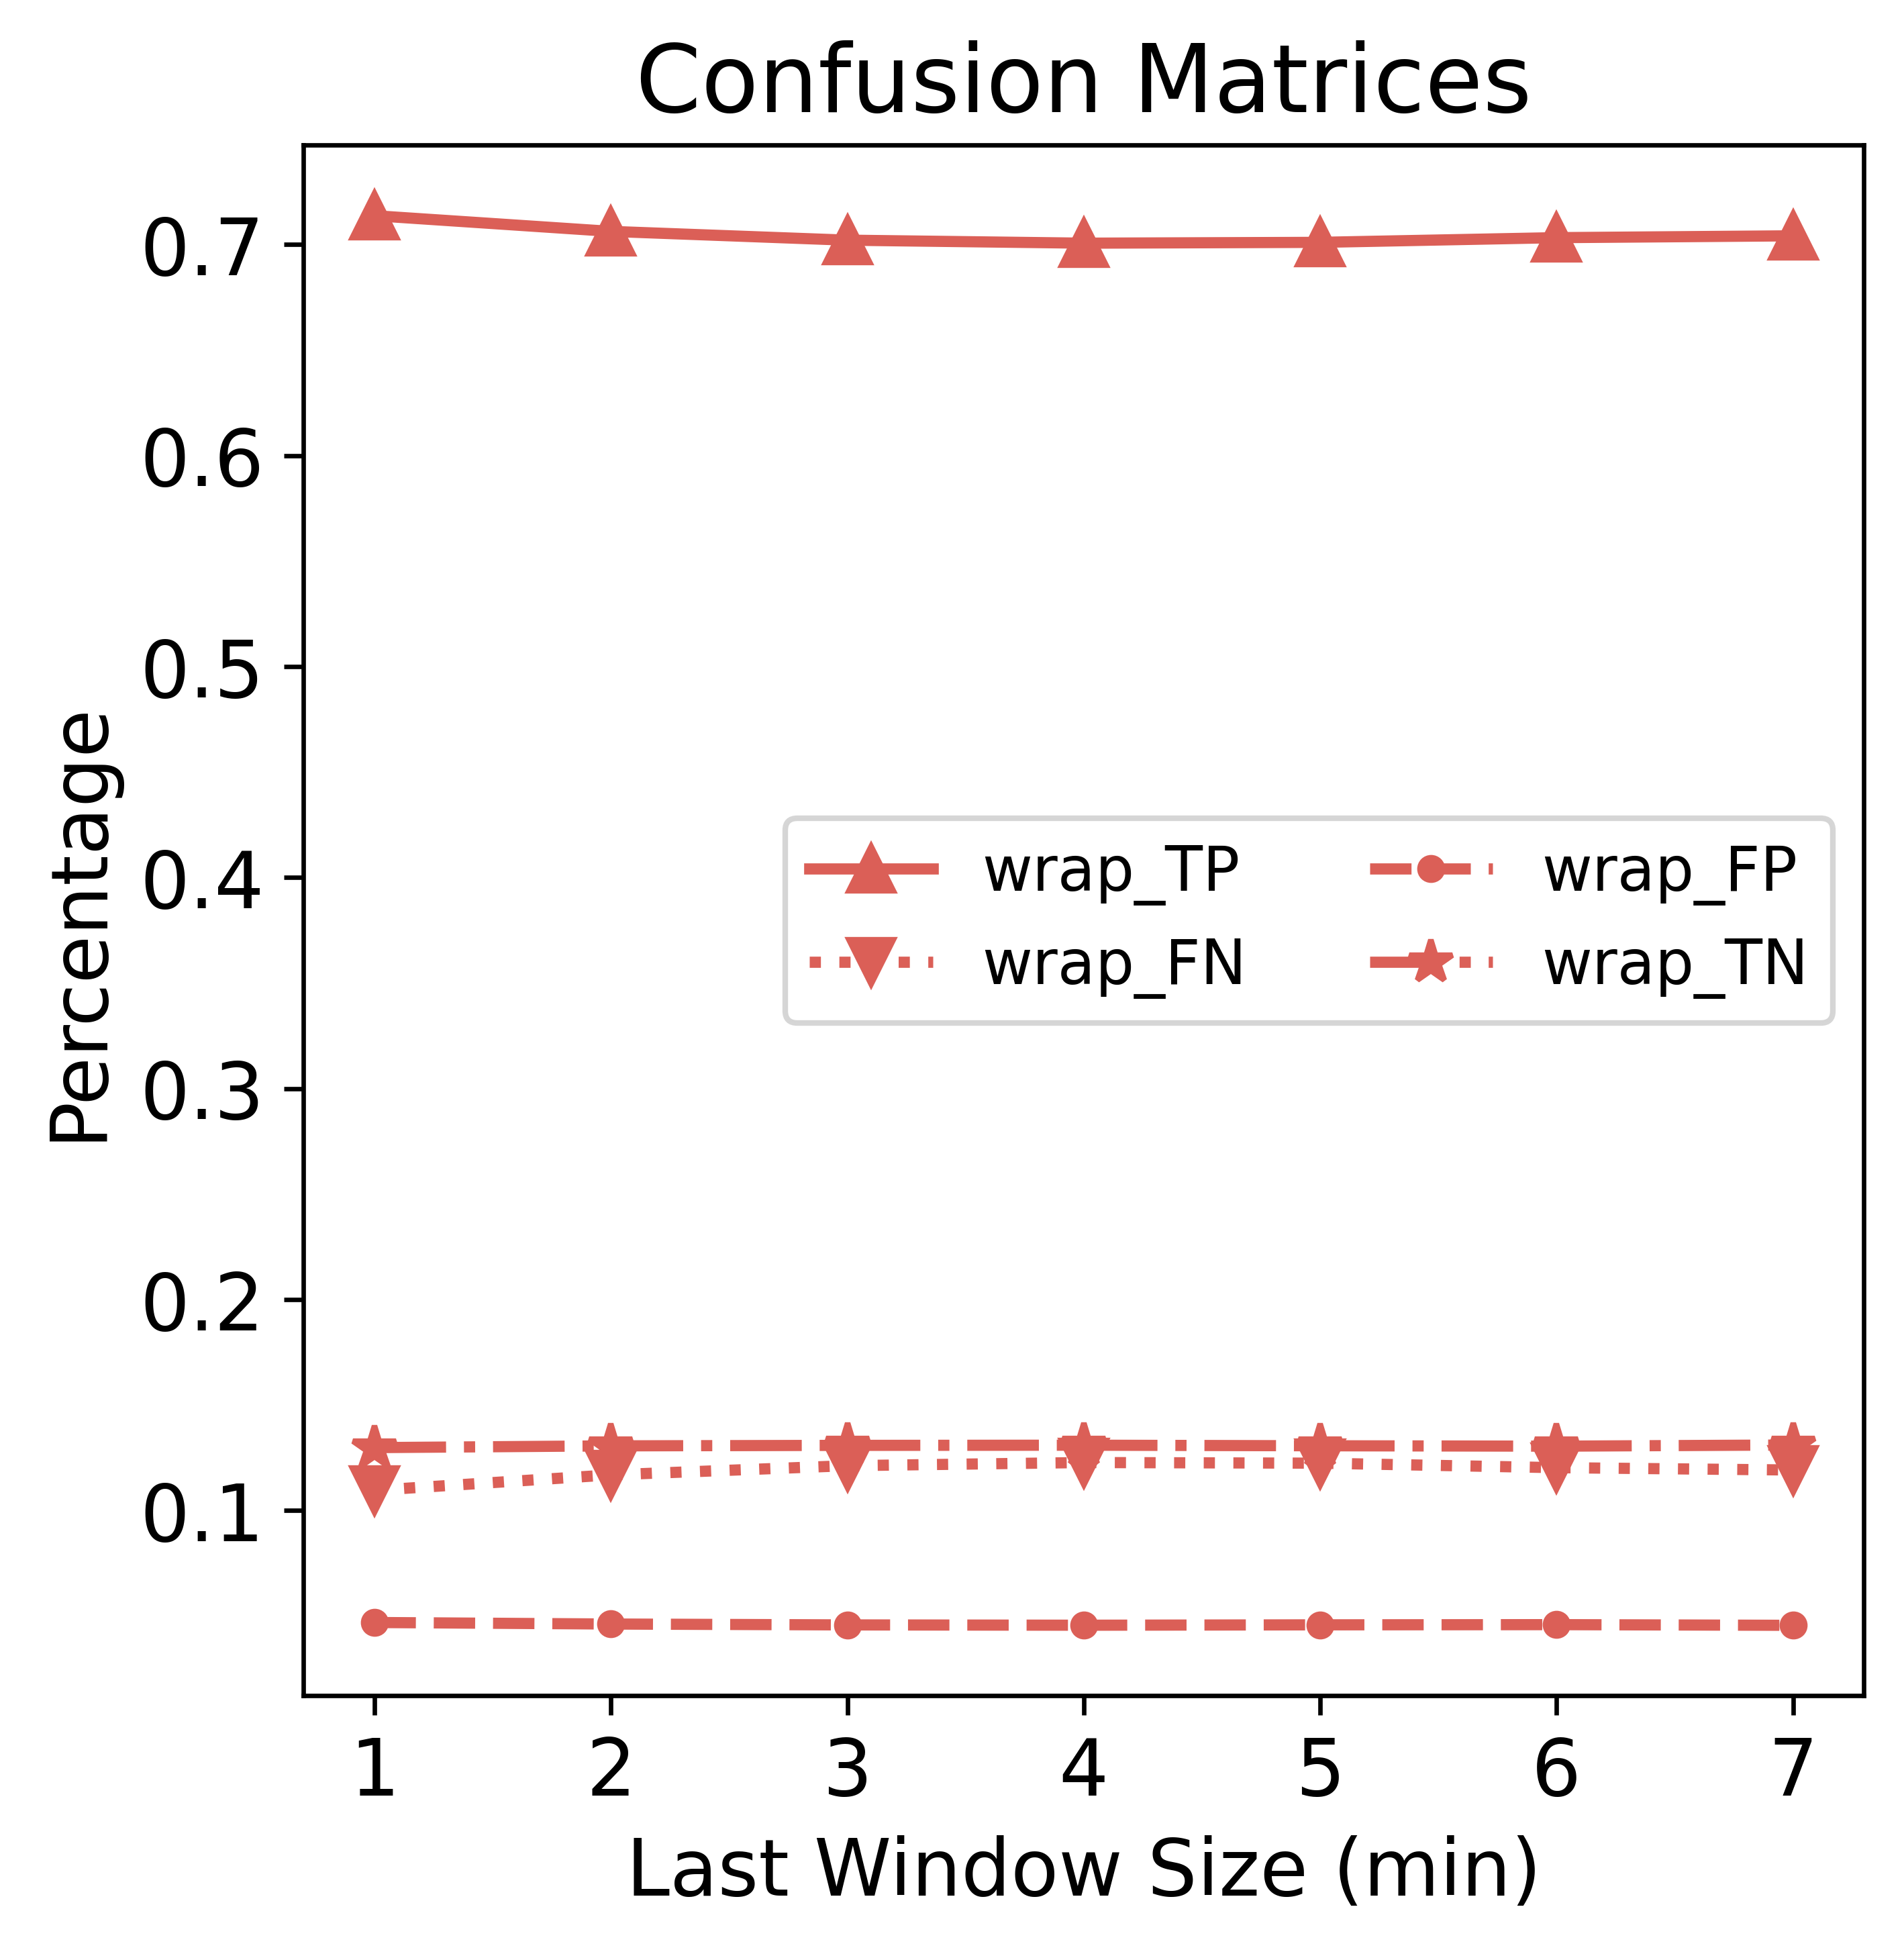
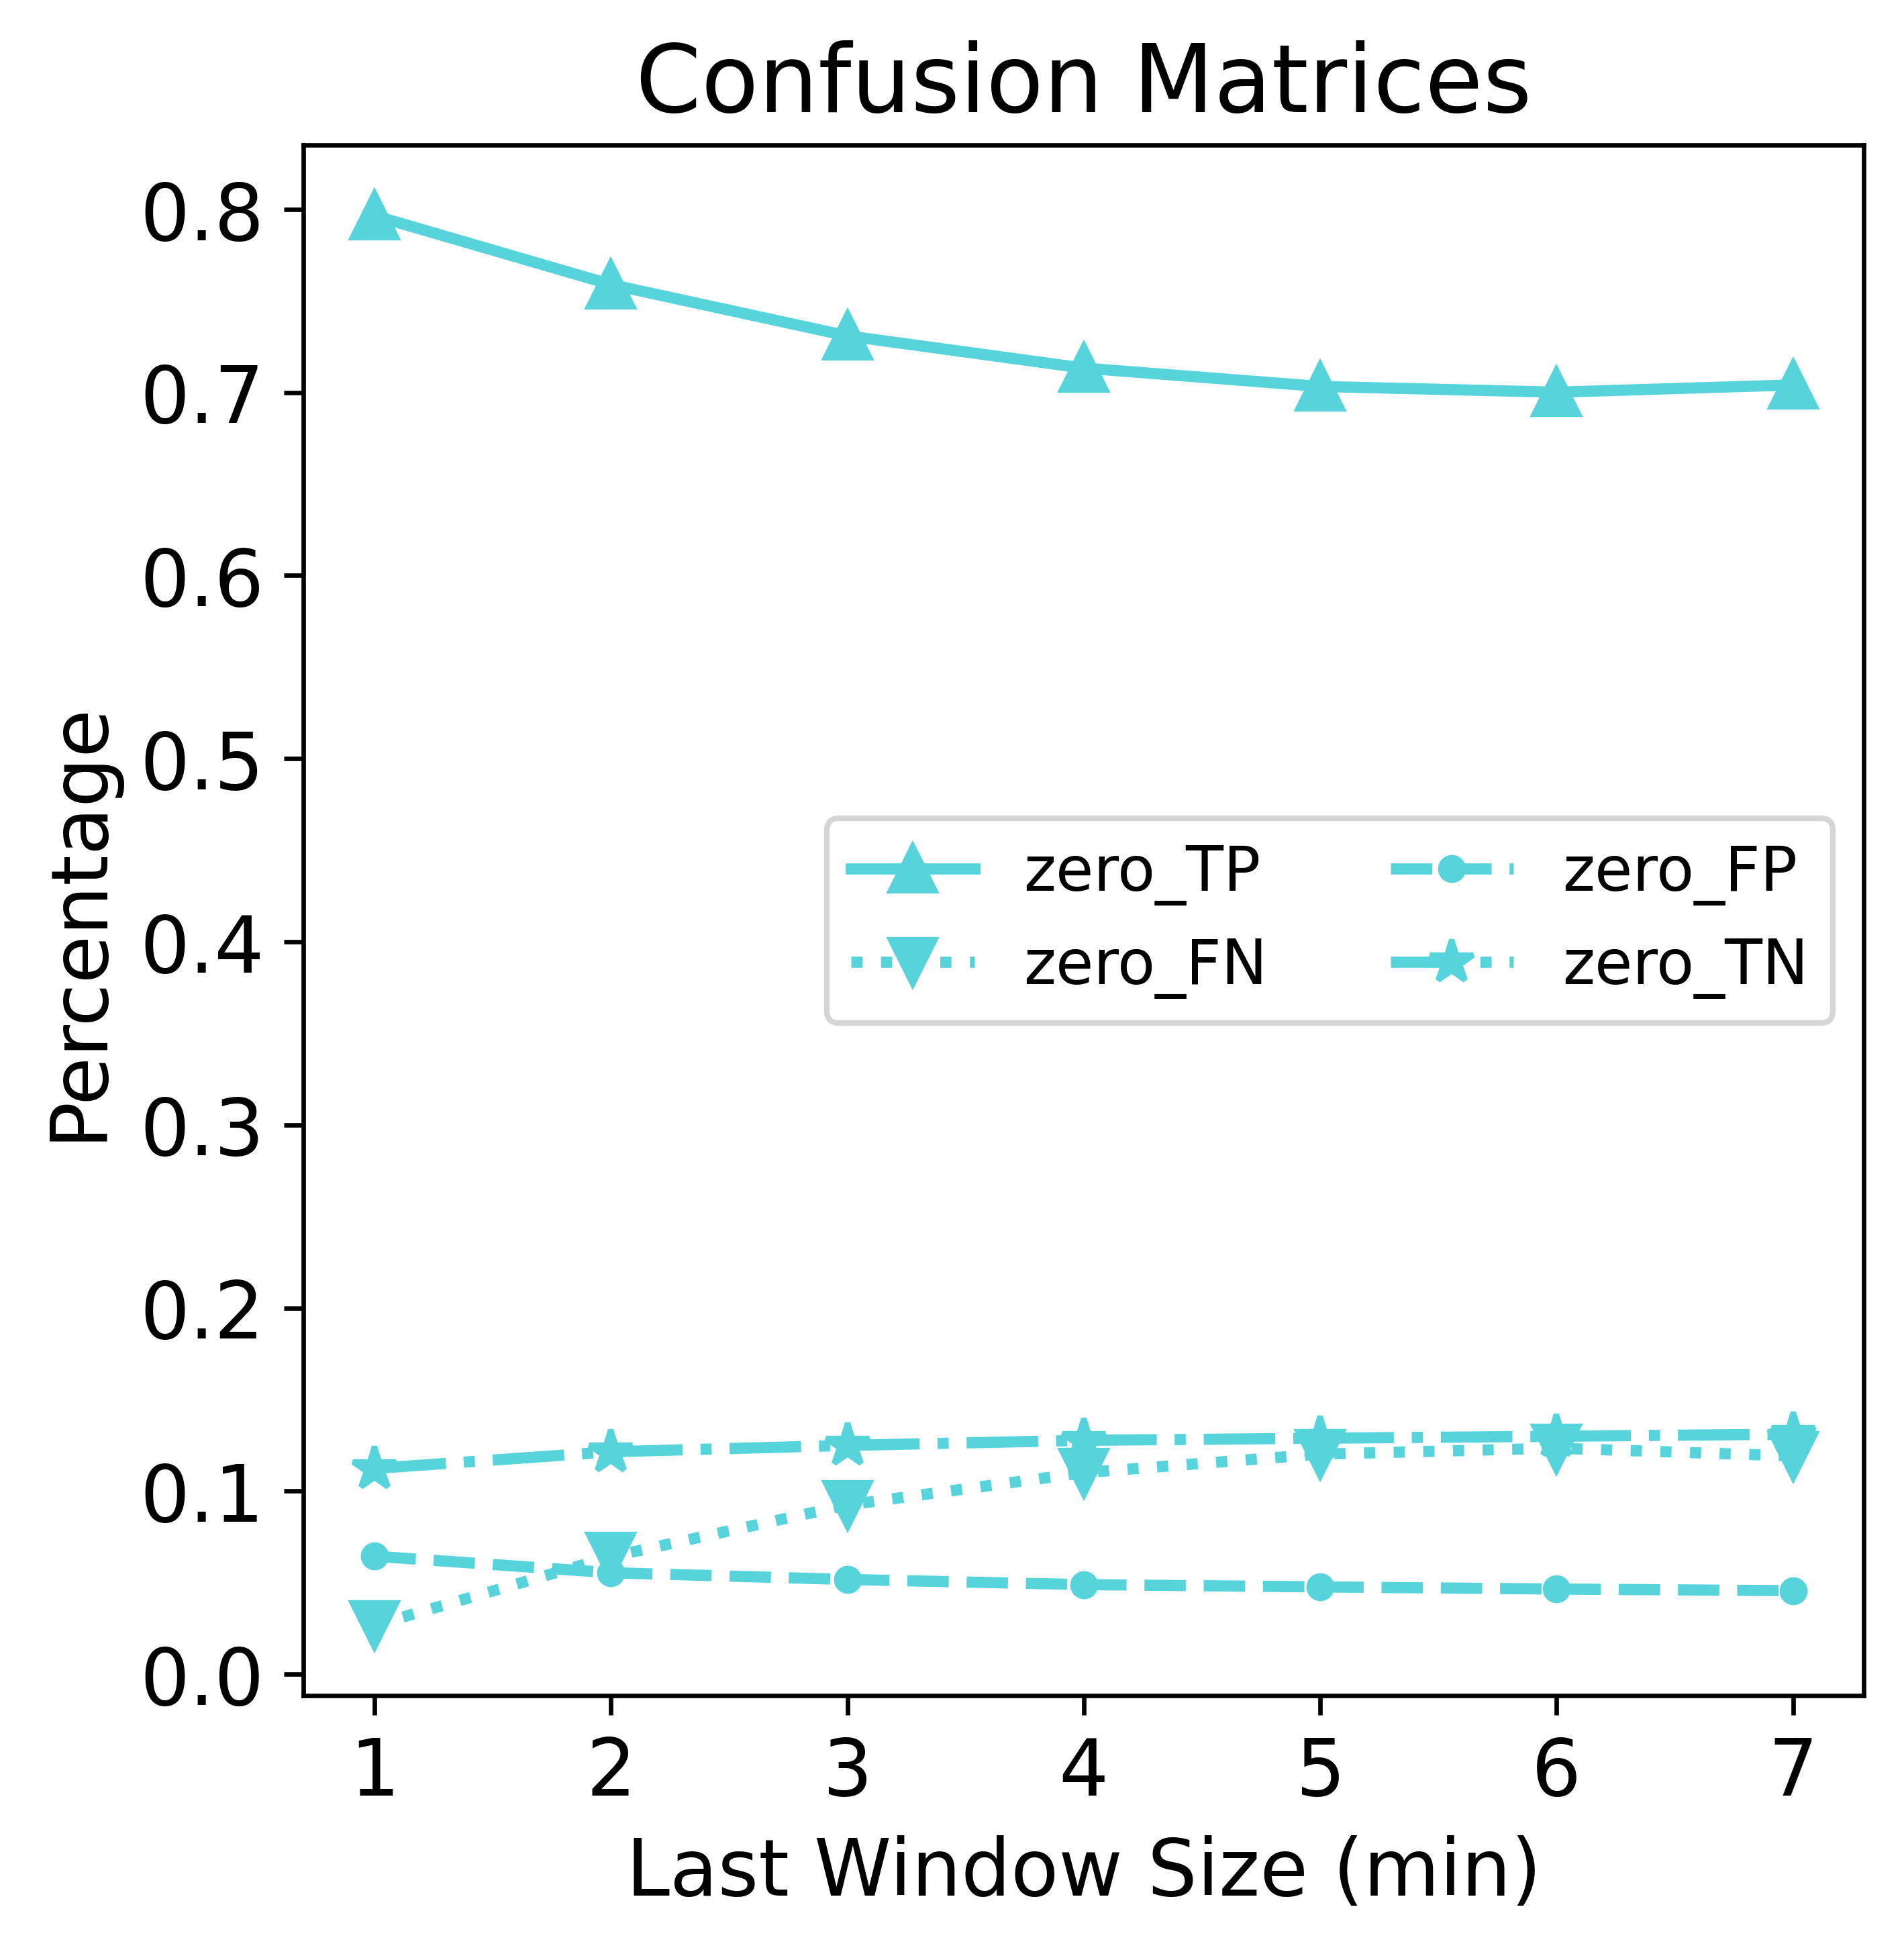
For zero-padding, as the amount of padding increases (from right to left), TP (sitting predicted as sitting) and FP (not-sitting predicted as sitting) both increase; FN (sitting predicted as not-sitting) and TN (not-sitting predicted as not-sitting) both decrease. Wrap-around padding is more stable and not showing drastic changes.
Sensitivity, Specificity, PPV and NPV
Specificity and sensitivity have opposite trends for zero padding. When at most padding (size 1 & 2), sensitivity (TP / (TP + FN)) is high mainly because FN (sitting predicted as not-sitting) drops. Specificity (TN / (TN + FP)) is lower mainly due to higher FP (not-sitting predicted as sitting).
npv=(TN / (TN + FN)) is higher for zero padding, mainly due to decreased FN. Our understanding is that with dominant zero padding, the model predicts sitting (positive) for any slightly sedentary-like reading. So it predicts negative only for the most apparent not-sitting data points (significant enough to overcome the noises introduced by zeros), resulting in a higher npv, or “making fewer mistakes about its negative predictions.”
Break-down Metrics Minute-by-Minute
The accuracy gain of zero padding is concentrated in the first few minutes of short windows; when the amount of true data increases, it gets closer to the wrap method. Regarding balanced accuracy, the two methods are also very similar.
Sampling Variance
To analyze the effect on the metrics brought by sampling variance, we randomly split the 21k examples into 10 parts; each part contains 2100 examples, which is equivalent to running 10 measurements. We draw the boxplots for them.
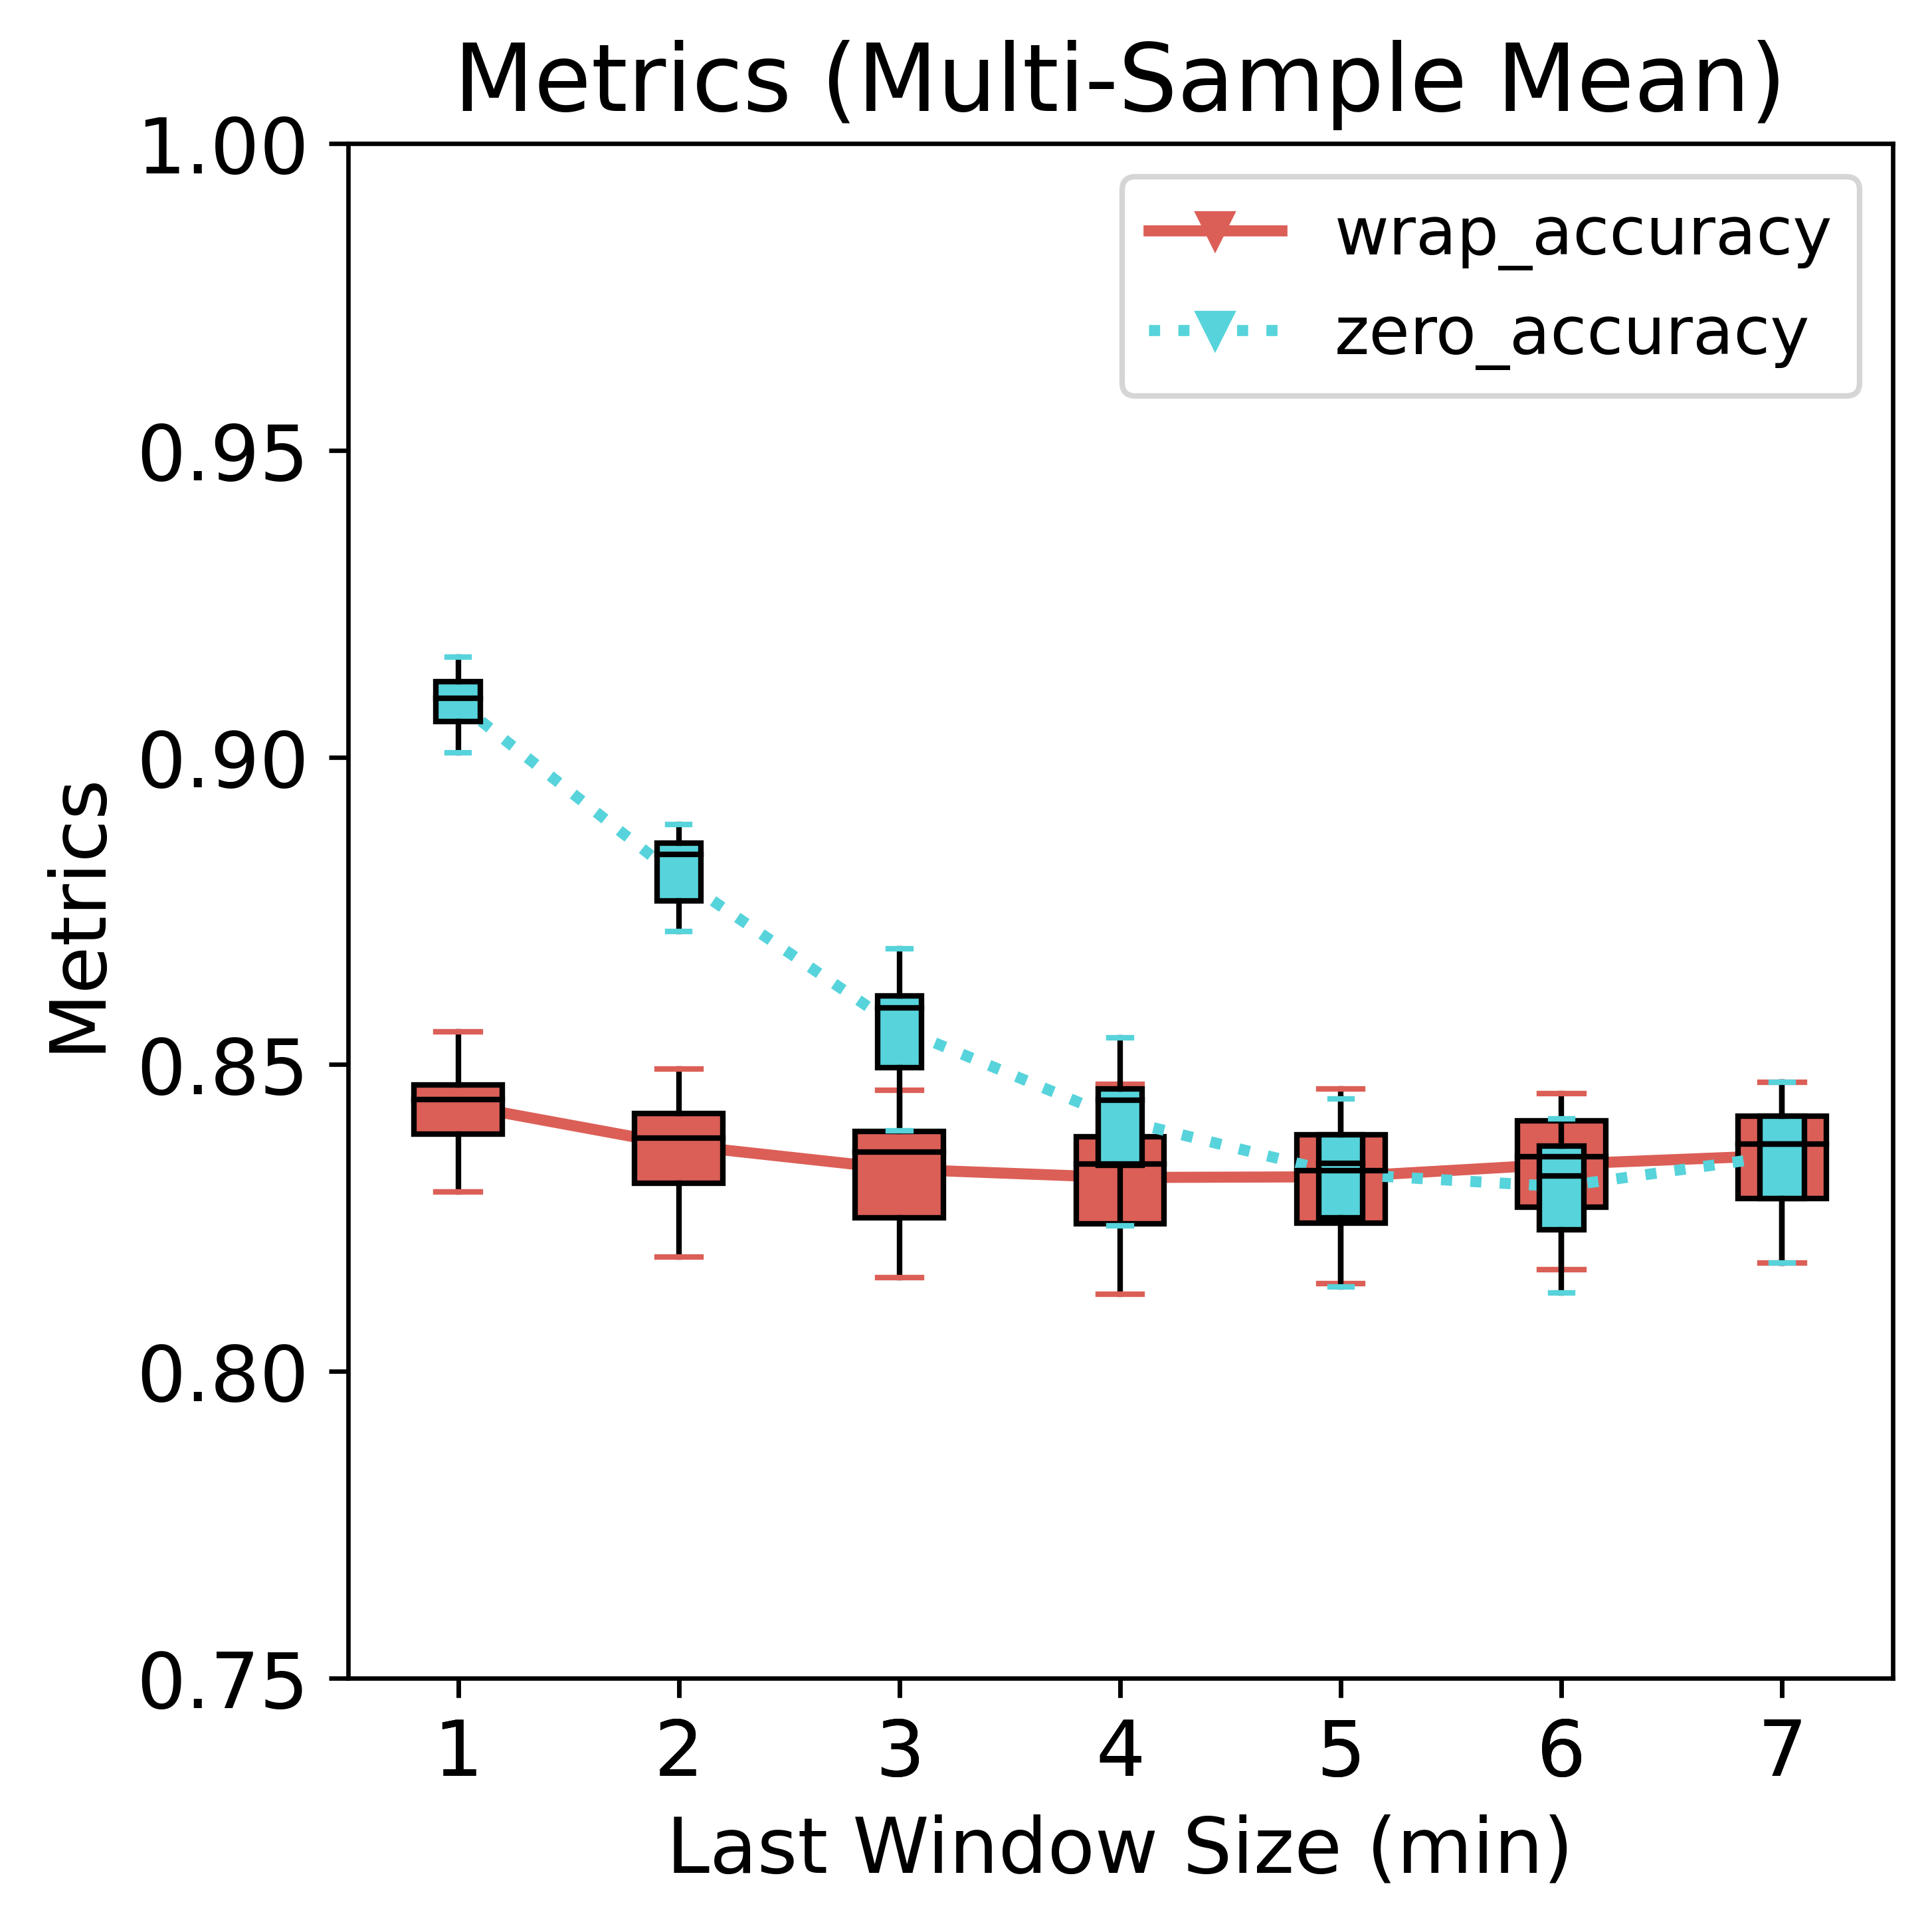
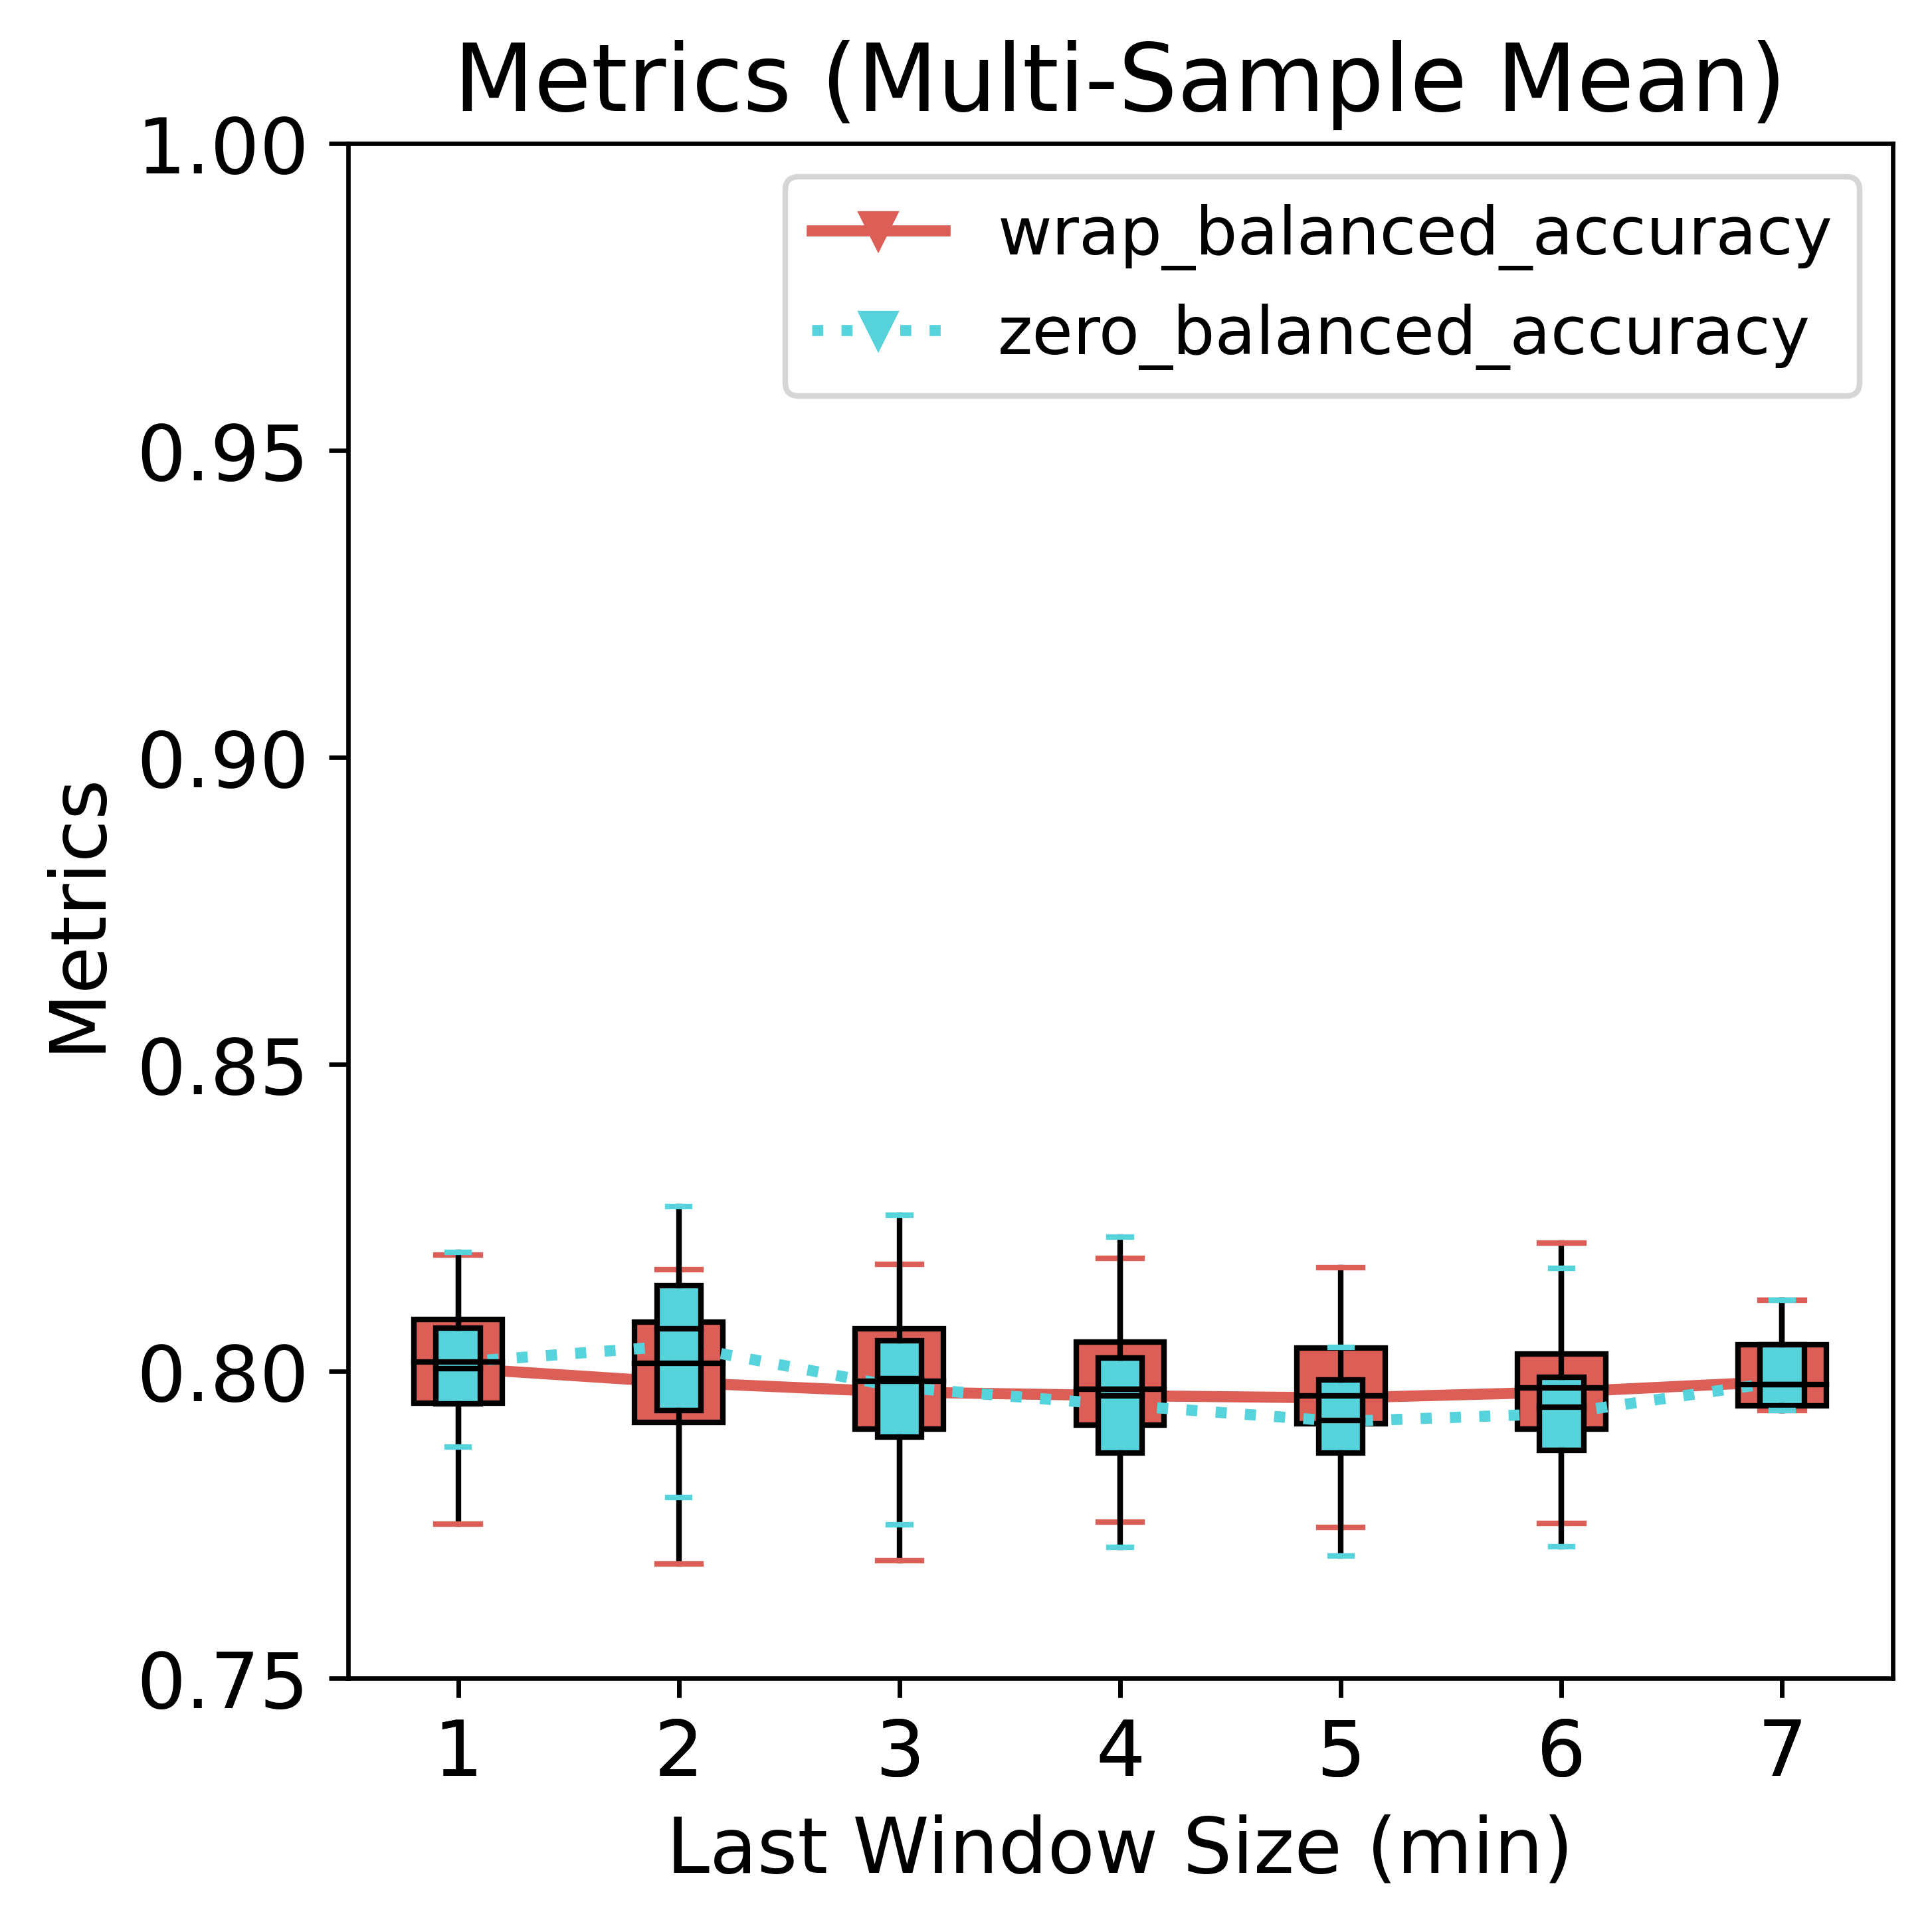
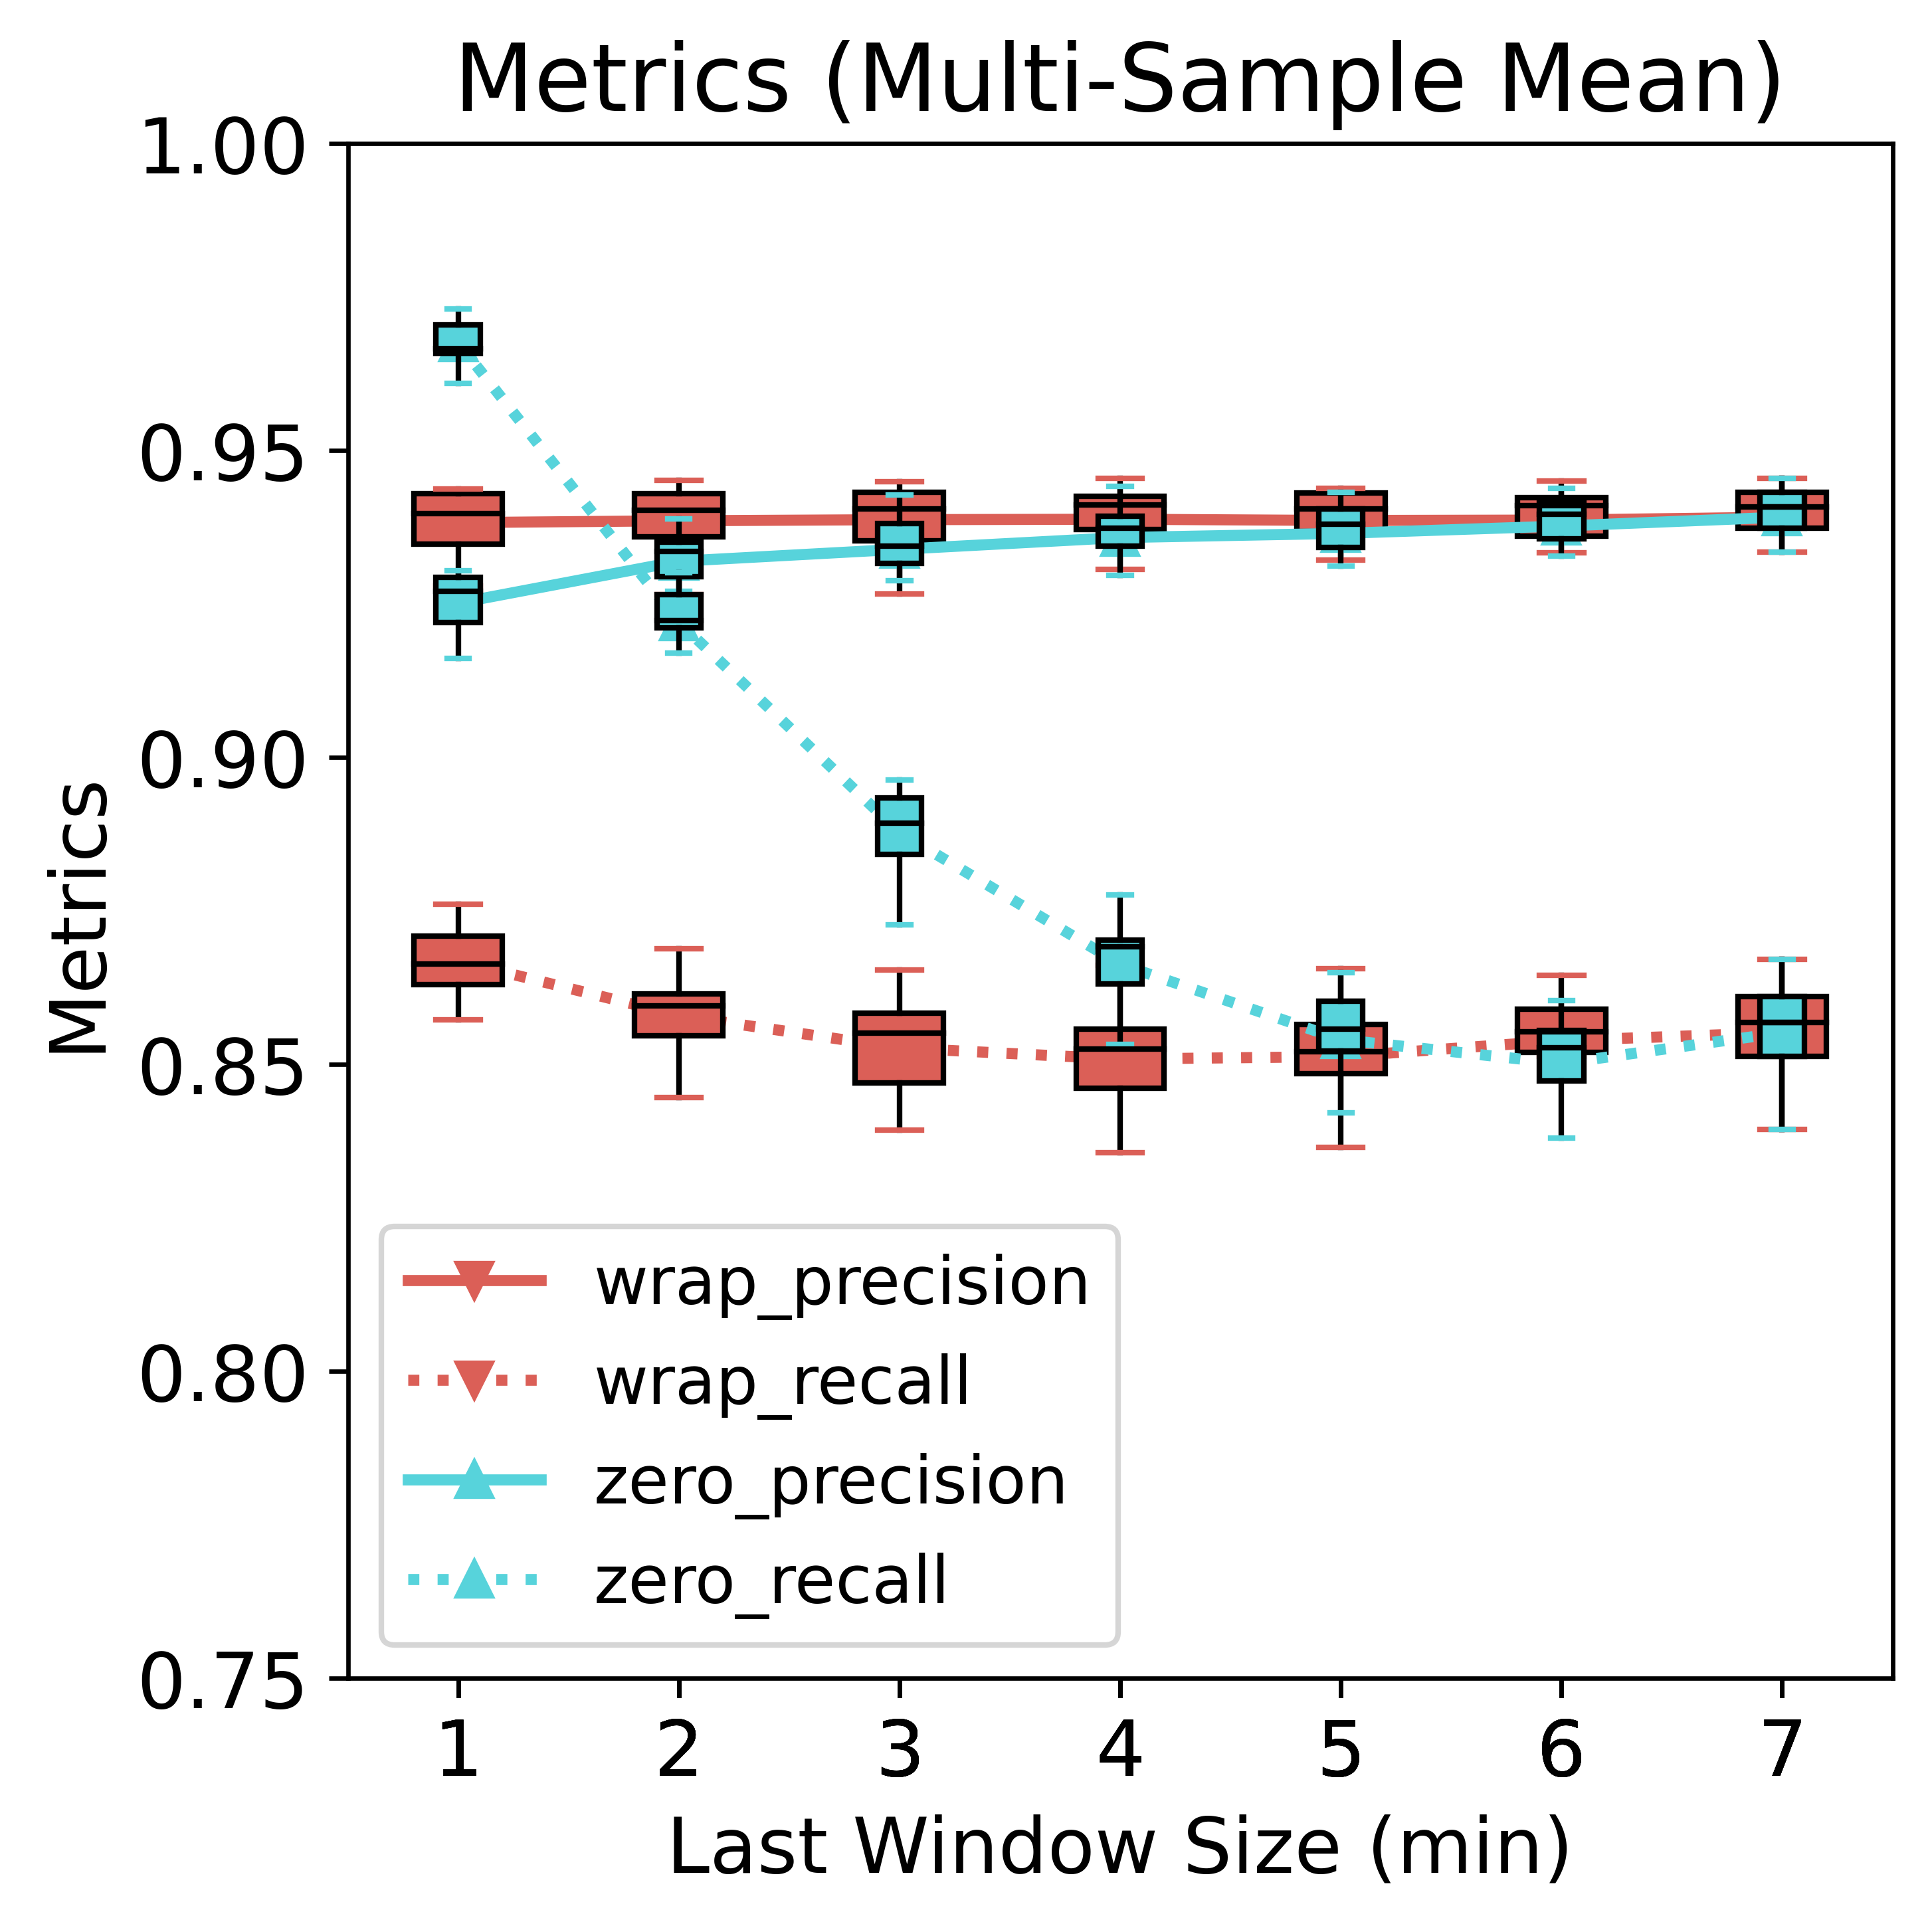
There is no noticeable difference in the variance between the two padding schemes.
Conclusions
Either method would work with subtle differences and consequences on the metrics; wrap is stable across window sizes; in a high prevalence (of sitting) setting, zero padding is easier and will work very well in general. However, note that both have very close balanced accuracy; therefore, none of them is clearly better.